These Brampton neighbourhoods have some of the highest COVID-19 percent positivity rates in Ontario
Published January 24, 2021 at 3:57 pm

Four neighbourhoods in Brampton have some of the highest COVID-19 percent positivity rates (percentage of positive COVID-19 tests in the area) in Ontario, according to Toronto-based research group ICES.
ICES provided an overview of the sociodemographic and clinical characteristics of individuals in Ontario who tested and confirmed positive for COVID-19 during the week of January 10 to 16.
From January 10 to 16, these areas in Brampton had the following percent positivity rates:
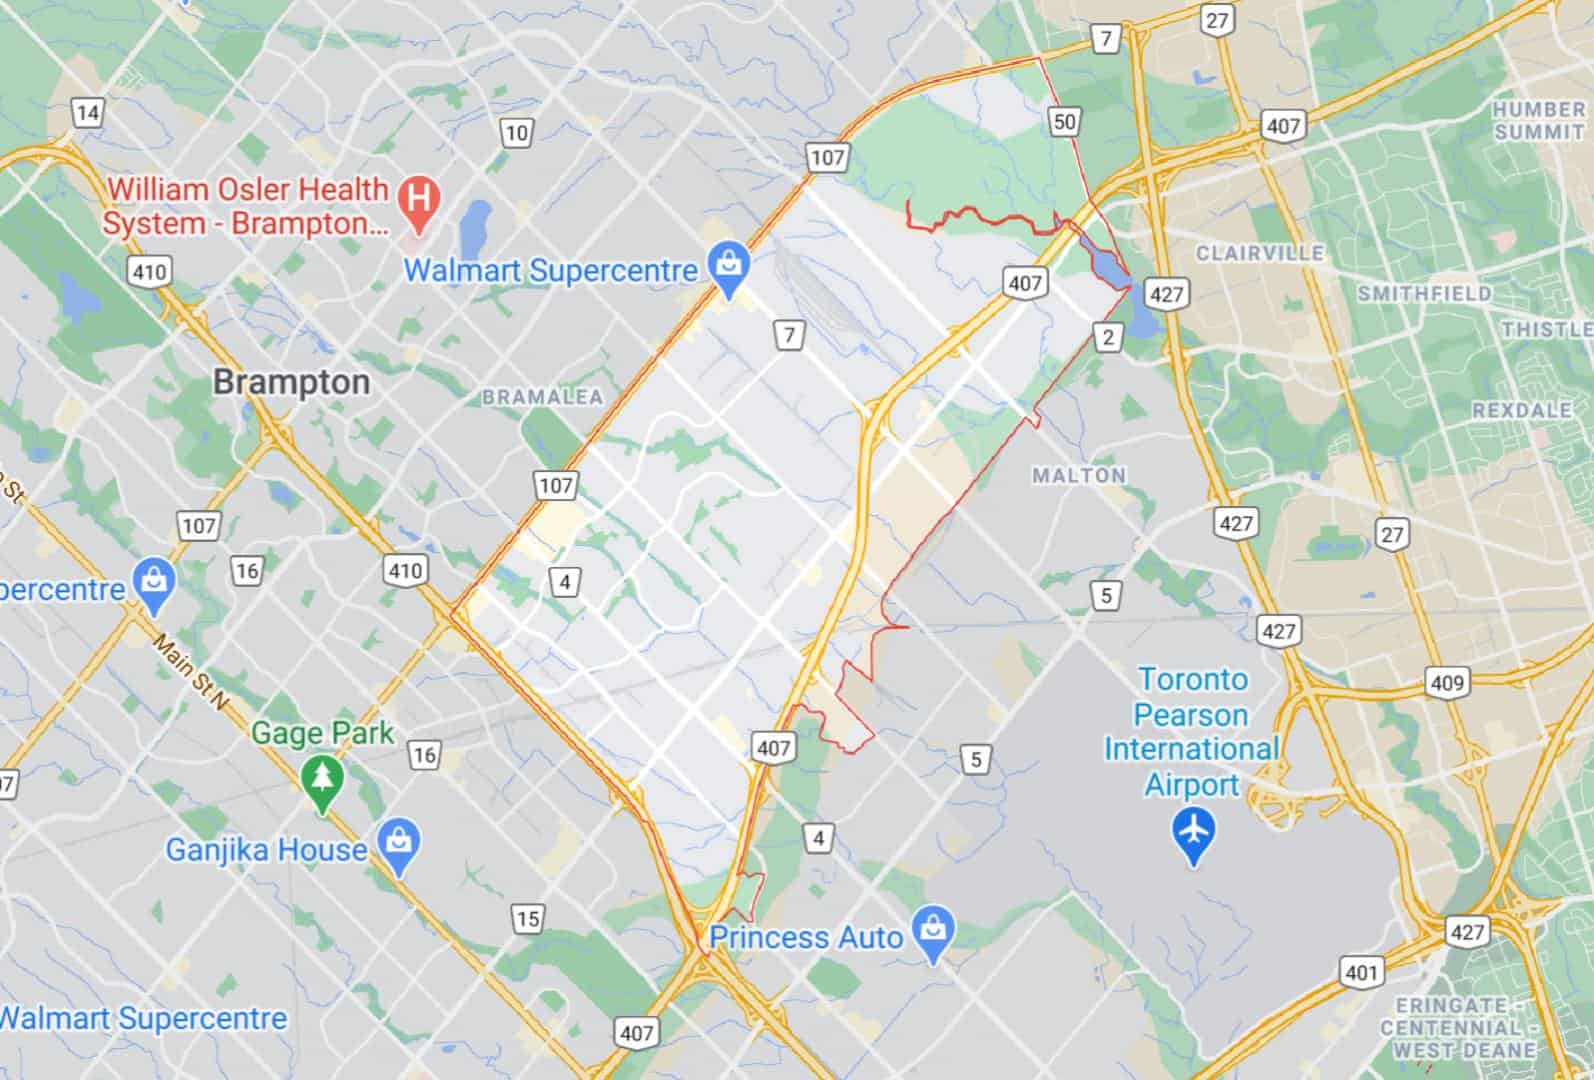
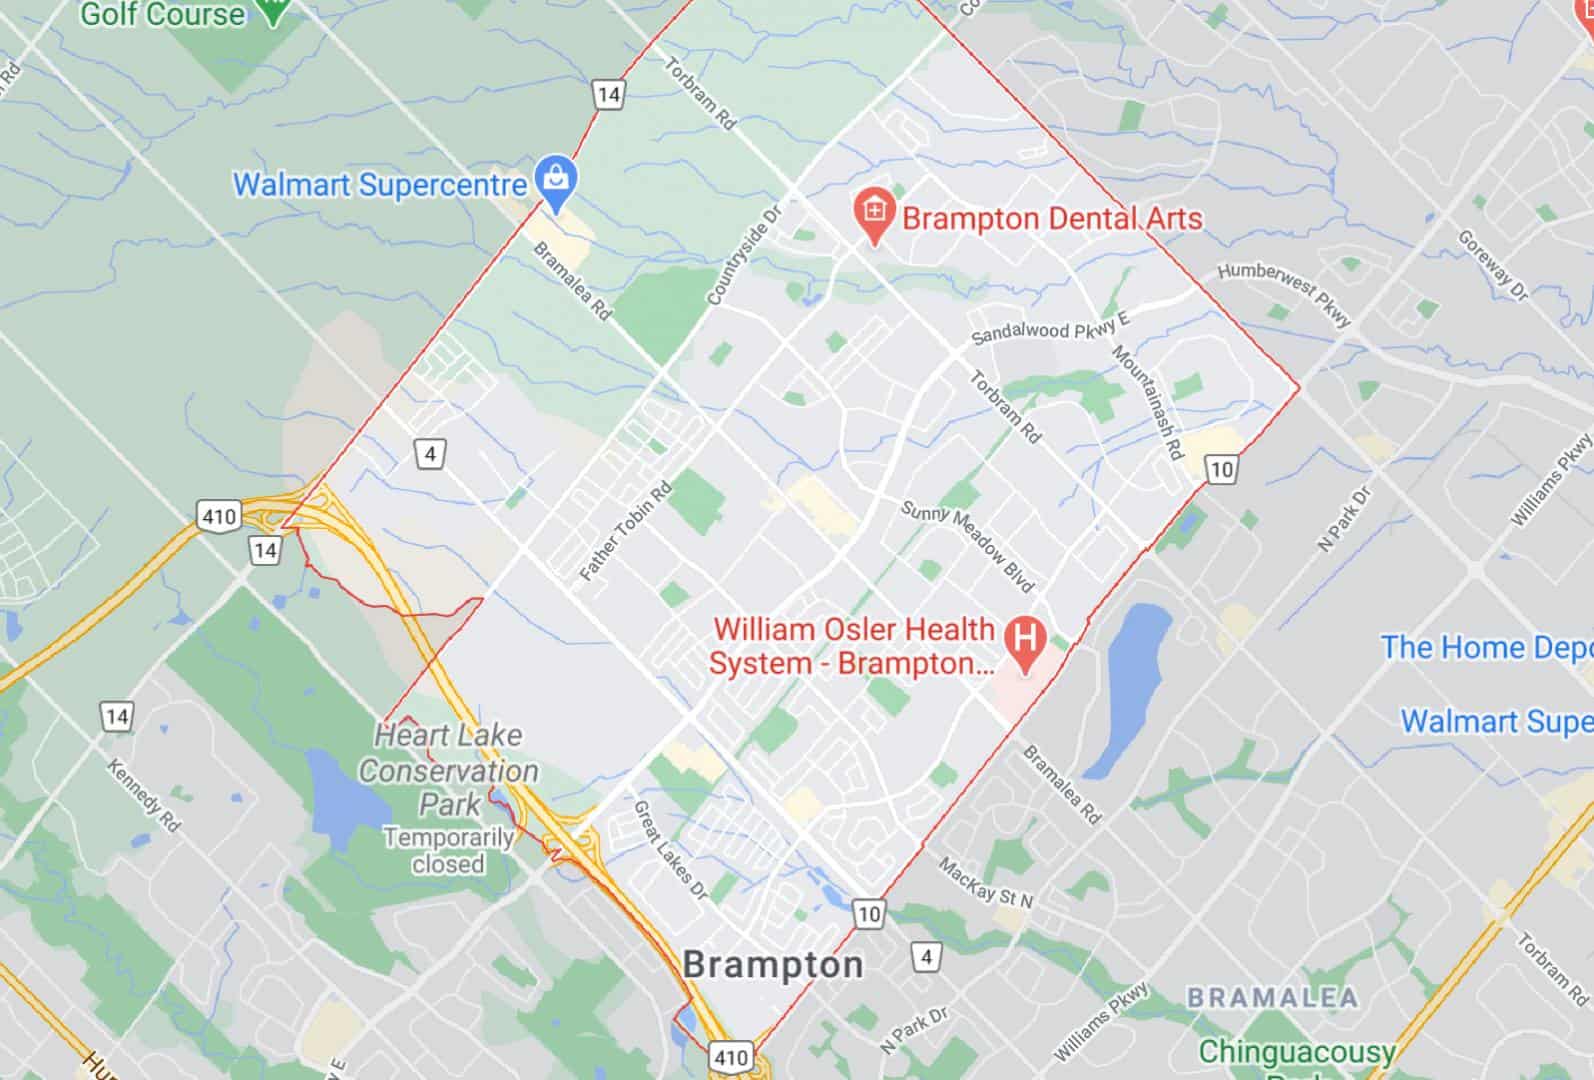
L6P, Brampton at 19.4% (area of Castlemore and The Gore Rd)

L6T, Brampton at 16.6% (area of Highway 407 from the 410 to Goreway Dr)

L6W, Brampton at 16.0% (area of Steeles Ave East and Kennedy Rd South)

L6R, Brampton at 15.8% (area of Bramalea Rd at Sandalwood Pkwy East)

The rest of the top 10 constituted one neighbourhood in Mississauga, four in Toronto, and one in York Region.
According to ICES’ data, Peel had the highest percent positivity (11.7%) out of all of Ontario’s 34 Public Health Units, followed by Toronto and Windsor-Essex County. Ontario’s overall percent positivity was 5.4%.
“The percent positivity was relatively lower among persons living in long-term care homes (4.5%), compared to those not living in long-term care (5.5%),” ICES said.
“Twelve FSAs (forward sortation areas) had 15% positivity or greater (within Toronto, Peel, and York), representing a decrease in the number of high-positivity FSAs compared to the week of January 3 (during which twenty four FSAs had greater than 15% positivity). Numerous high-positivity FSAs (L5W, L6W, L6Y, L4T, N4W, M6M, M1C, L4Z, N8H, MU, L4L, M2J, M2R) were also experiencing outbreaks in long-term care homes.”
ICES says percent positivity increased among children over the course of December, but these changes did not always correlate with changes in incidence, likely due in part to decreased testing rates.
Testing rates decreased over the course of December for all age groups, especially for children aged 2-13 years.
The full data is available to read here.
Images courtesy of ICES
INsauga's Editorial Standards and Policies


