
Six Brampton areas are seeing some of the highest COVID-19 percent positivity in the province
Published February 20, 2021 at 1:11 am
Several areas in Brampton are among those with the highest COVID-19 percent positivity rates (percentage of positive COVID-19 tests in the area) in Ontario, according to recent data from Toronto-based research group ICES.
ICES listed 50 areas in Ontario with the highest percent positivity rates for the week of February 7 to 13.
Of the 50 listed, the following are in Brampton:
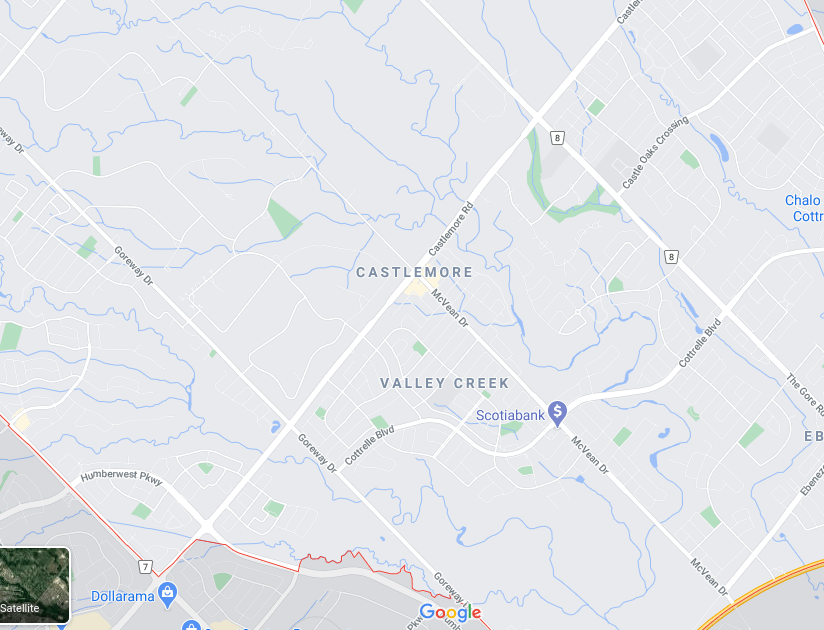
L6P at 13.3% (area of The Gore and Castlemore)
3rd highest percent positivity neighbourhood in Ontario (2nd highest during previous week)
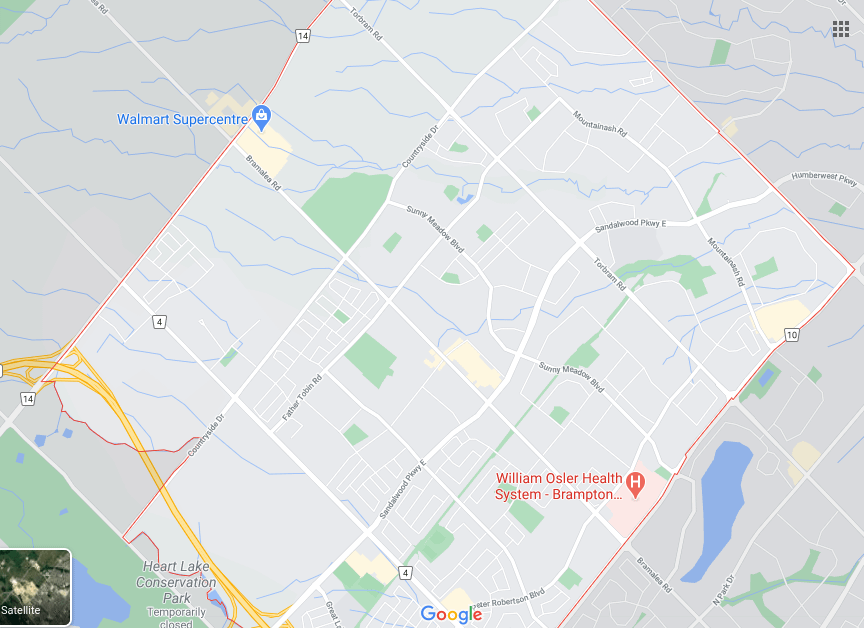
L6R at 10.0% (area of Sandalwood Pkwy E and Torbram)
8th highest percent positivity neighbourhood in Ontario (13th highest during previous week)
Videos


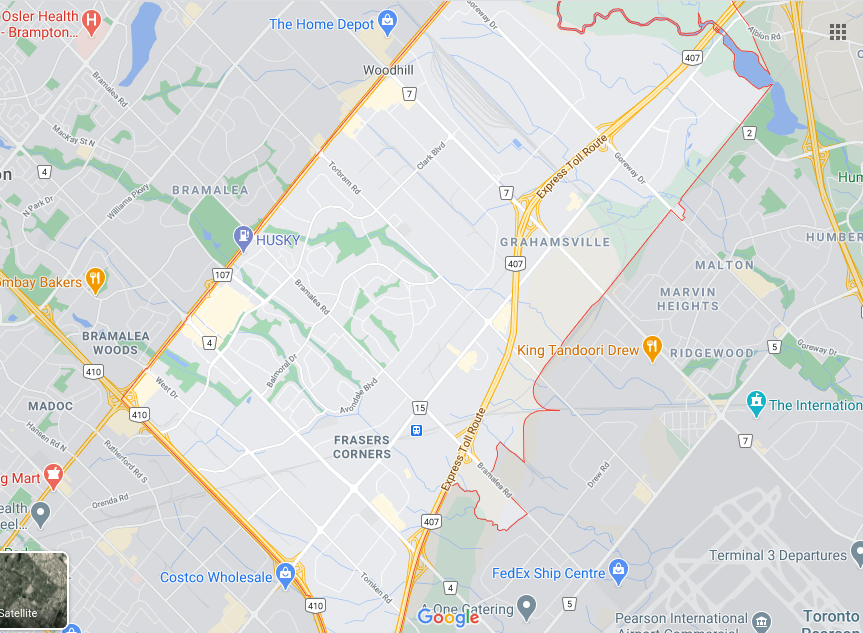
L6T at 8.4% (area of Highway 407 and Airport Rd)
17th highest percent positivity neighbourhood in Ontario (27th during previous week)
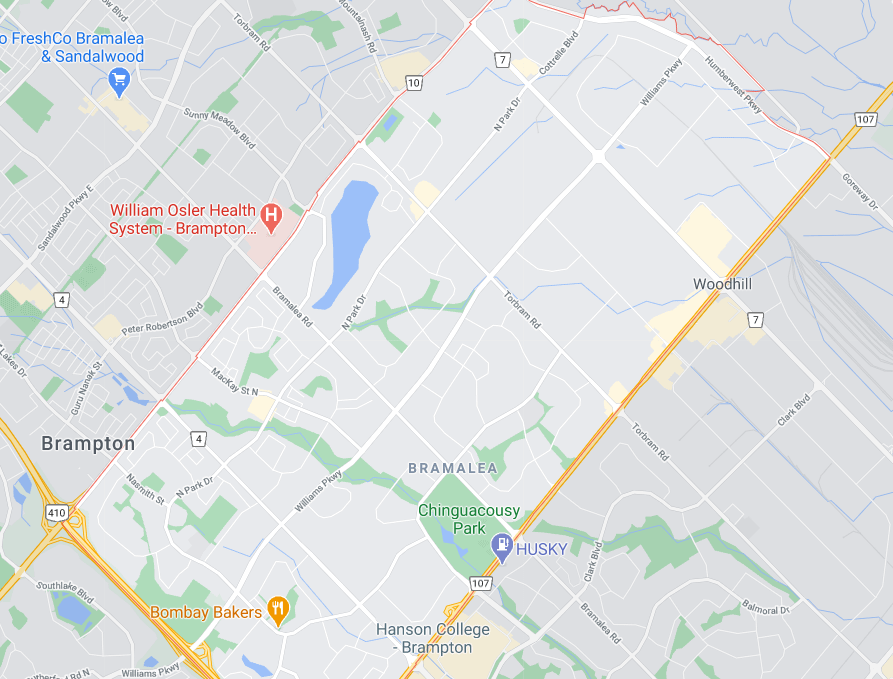
L6S at 8.0% (area of Williams Pkwy and Bramalea Rd)
21st highest percent positivity neighbourhood in Ontario (50th during previous week)
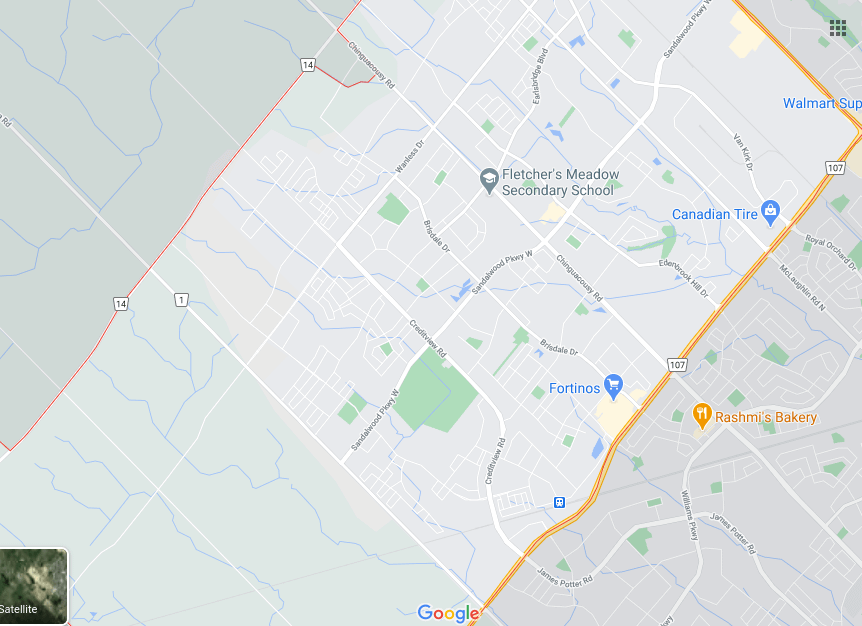
L7A at 7.5% (area of Highway 410 and Williams Pkwy)
24th highest percent positivity neighbourhood in Ontario (19th during previous week)
L6Z at 6.7% (area of Kennedy and )
34th highest percent positivity neighbourhood in Ontario (not listed during previous week)
*areas that are also experiencing outbreaks in long-term care homes


“For all Ontario residents, the overall percent positivity among those tested for COVID-19 during the week of February 7 was 2.7% (versus 3.1% the previous week),” ICES reports.
“The percent positivity was relatively lower among persons living in long-term care homes (0.8%), compared to those not living in long-term care (2.8%).”
The full data is available to read here.
Data courtesy of ICES
insauga's Editorial Standards and Policies advertising