
New Census Data Reveals Immigration Skyrocketing in Mississauga and Beyond
Published October 25, 2017 at 8:38 pm

If there’s one thing that all Mississauga residents have no doubt noticed, the city–and, in fact, the entire country of Canada–has become increasingly more diverse over the years.
Now, recently released census data that delves into immigration, the Aboriginal population and home ownership has revealed that the number of immigrants in Canada is higher than ever before, with 21.9 per cent of the country’s population identify as immigrants or permanent residents.
The data also reveals that the second generation Canadian population sits at 17.7 per cent and that visible minorities account for 22.3 per cent of the population.
The number of recent immigrants who landed in Canada between 2011 and 2016 sits at 1,212,075.
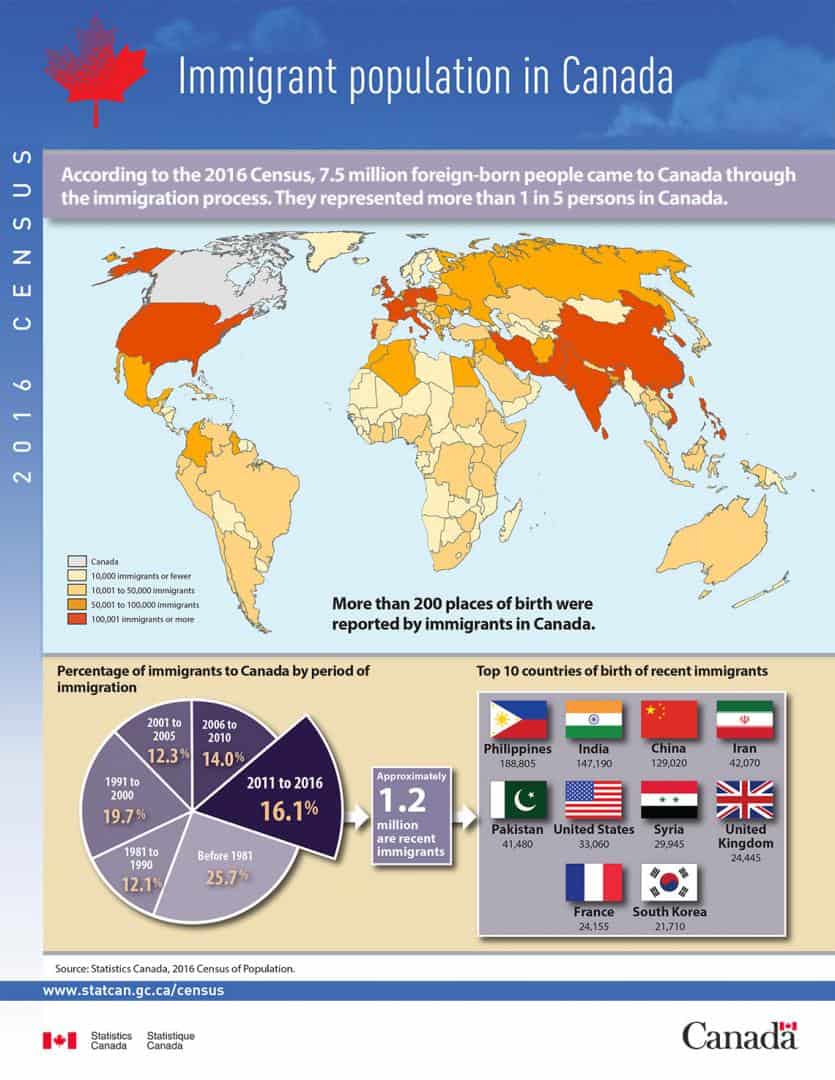
According to the 2016 census, 7.5 million foreign-born people came to Canada through the immigration process. They represent more than one in five people in Canada.
Videos


What countries are people typically leaving from? According to the data, most immigrants are coming from The Philippines, India, China, Iran, Pakistan, the United States, Syria, the United Kingdom, France and South Korea.
As far as Mississauga goes, the city is home to 620,045 Canadian citizens and 95,435 non-citizens. As far as immigrants go, 320,750 people identify as non-immigrants while 381,730 say they are new Canadians. Before 1981, just 77,125 people identified as immigrants.
In terms of where immigrants in Mississauga are coming from, census data indicates that 48,665 come from the Americas (north and south), 88,515 from Europe, 24,290 from Africa and 219,420 from Asia (with many coming from India, China, Pakistan and the Philippines). A substantial 398,030 identify as first-generation newcomers.
As for why people come to Mississauga, 172,665 are economic immigrants, 91,590 are sponsored by family and 41,820 have come as refugees.
The total visible minority population in the city sits at 408,930.
In terms of Aboriginal residents, 4,175 residents identify as First Nations.
The census data also explored household characteristic and found that of 240,910 private households, 174,130 residents own their dwellings and 66,785 rent them. Not surprisingly, a lot of residents are opting to live in condos–63,305 to be exact. As of now, data indicates that just 82,055 residents live in homes with four or more bedrooms.
As far as the age of the homes people live in go, 76,465 (the biggest stand-alone chunk) people live in homes built between 1961 and 1980. Only 9,000 live in homes constructed between 2011 and 2016.
Fortunately, most people live in safe and well-maintained homes–229,645 to be exact. Less fortunately, 11,265 live in homes that need significant work.
As far as other demographics go, 24,510 people between the ages of 25 and 34 are the primary maintainers of their households, versus 61,770 people between 45 and 54 and 53,720 people between 55 and 64 years of age.
A troubling 25.7 per cent of residents spend more than 30 per cent of their income on their homes. The average monthly cost of an owned household sits at $1,697, with the average dwelling being worth about $642,468.
As far as tenants go, the data indicates 46.3 per cent of renters spend more than 30 per cent of their income on shelter costs. Rent costs tenants an average of $1,281 a month.
For more info, click here.
insauga's Editorial Standards and Policies advertising